Sunday, October 28, 2007

BI Master - Attributes of Decision Process

The attributes of a decision process is represented in the decision-data pyramid, which shows the transformation of ‘Data’ to ‘Infor­mation’ to ‘Knowledge’ to ‘Decision’ with rapidly increasing ‘value or worth’ as we move from the bottom of a decision pyramid to the top. Data by themselves have little value or worth; once they are processed, analyzed, and organized, they become information. Once the information is processed by the user to develop and enhance understanding of a situation or a problem, it turns into knowledge. It is this knowledge that can reduce the risk of undesir­able consequences of a decision.

Operational decisions involve day to day operations, dealing with problems that often become well known, such as how many units of a product to stock, or what employee to assign to what task. These decisions usually are repeated quite often.

At the other extreme, strategic decisions involve the long-range plan of the organization. Strategic decisions occur much less often then operational decisions, but affect the entire firm, may involve large sums of money, and there is inherently more risk involved in making them.

Tactical decisions are usually required more often than strategic decisions, but not as often as operational decisions. Middle level managers usually have more discretion than operational decision makers, but are constrained by strategic plans.


Strategic Level
Organizational vision and mission
Organizational policies
Target markets
Long-range goals
Future-oriented

Tactical Level
Middle management
Mid-range goals
Effective resource allocation
Budgeting, for example.

Operational Level
First line management
Short-range goals
Day to day activities (efficiency)

There are persons that are so focused in the goals and gives so high importance to the methodologies that a problem leaves of being a problem.
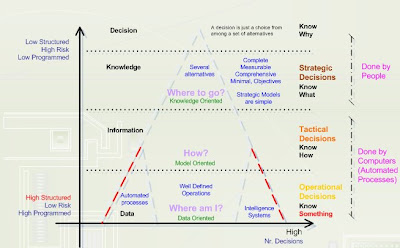
The classic decision-data pyramid will be transformed in a losangle, because the solution to resolve a problem will be repeated and is converted in an automated process, as you can see in the following picture:


Following Gorry and Scott Morton approach, the degree of structure for a problem changes as decision makers learn more about problems.

And each problem could be classified from different levels:


This picture demonstrates well the problem decision, and following my teacher homewrok request I will describe in the next post, the most important level - management level, tasks and sub-tasks.

Tuesday, October 23, 2007

BI Master - DSS Concept and Components

Dear Friends,
Last week was very hard for me. I was dealing with a big problem with my data warehouse design that I was described in the previous post, and consequently I was sick for two days. With the support of my data warehouse teacher, Patricia Narciso, the problem is currently resolved and I will give you all the explanation in the next post.


Now that I already excused myself, I will start write a little more about the concepts that I have been collecting with my BI master degree and some books that I was reading and indicated by my SIAD teacher, Maria José Trigueiros.

The subject is Decision Support Systems, DSS. Do you know what it is?! If not, don’t worry, I only heard these words few weeks ago… Everything has a begin date!

The study of DSS is really about people, about how people think and make decisions, as well as how they act on and react to those decisions. There isn’t an universal definition about DSS, but there are several investigators in this subject that I’m agree with.

“DSS is an interactive computer-based systems, which help decision makers, utilize data and models to solve constructed problems” (Scott Morton, 1971)

The DSS investigators better knowned in my master degree classes and the authors of some decision making best seller books are Herbert Simon, George Marakas, Samuel Bodily and Covey. I know there will be more experts in this subject but in this post I will focus on the Simon three phases decision making process and in the DSS components.

DSS components


Decision Making
A process of choosing among alternatives courses of action for the purpose of attaining a goal or goals.

The DSS Goal
Increase the effectiveness of decision making.

Will continue........

Sunday, October 14, 2007

BI CaseStudy - Slowly Changing Dimension (Type2)

The Problem
Store historic data in a relation ManyToMany between two Dimensions.

The Scenario
For each day I need to import via ETL about 5.000 rows of financial movements into a FactTable.
This data must be viewed by several dimensions: Entidade, Carteira, Mesa, Folder and FolderGroup. Each dimension has several variables that is related only by the dimension, and these variables must me store along time. So I need to store historic data for each dimension and In this project there is two important areas:
1. Entidade, Carteira, Mesa and Folder is a typically a Slowly Changing Dimension (Type2) and these dimension are structured as a snowflake. (Yes… I know Kimball doesn’t recommend the use of snowflakes, but I think for this case the data could be better understandable and the data model will be more easy to maintain in the future)
2. FolderGroup is a ManyToMany relation between Dimension Folder and Dimension Group and a Bridge to link the both.

Now, I’ll show the current structure and then I’ll explain my problem.
As I told you before, my problem is that I cannot create a Slowly Changing Dimension (Type 2) when there is a relation ManyToMany between Dimensions.
In my project I have the typically SCD (type2) that is working good and I fell data model very “clean” and understandable.


Sample Data from Slowly Changing Dimension (Type 2)
I divided Entidade on Entidade and EntidadeHistoric because the attributes never change and by this way I’ll avoid redundant data in the dimension. If for any unexpected reason I need to change ENT_Name or ENT_RelatorioKVaR, it will be a typically SCD (Type1) and I’ll do a classic update to the dimension row. The other reason of this division is that I only need to save historic data for hENT_RacioCooke. (I have other fields to store but for this example I’ll omit it)

The value 9020 is the Foreign Key to the Time Table and correspond to the date 10-10-2003.
So, from this picture we can see that for Lisbon, the field hENT_RacioCooke, between date 8888 and 9020 is 0,5 and between 9021 until now is 0,1.

Sample data for my Snowflake schema
I decided to create the relations below as Snowflake, because I felt that could be a better way to maintain the data in the future.
The business keys from each level (ENT_ID, CRT_ID, MESA_ID and FOLDER_ID) are in a string format to be coherent with the source data of ETL and to be more comprehensive for the admin users that will be analyzing data directly to OLAP and OLTP databases.


Based on the images posted before, I will show you how the SCD (Type 2) is working on my project.
I decided not include all the structure and focus only in the essential data to understand my pending problem.


As you can see in the above picture, this is my SCD (type 2). I’ll test if this structure is working good creating the follow SQL query:

And the result is:

Imagine you need to add a new field to the table Dados with the formula : D_MeasureX_ENT=D_MarketValue*hENT_RacioCooke.
For the same D_MarketValue value (10.000) in the days 9019 and 9023, the new field D_MeasureX_ENT is different because the RacioCooke between 8888 and 9020 was 0,5 and between 9021 until now is 0,1.


OK.. now that you understood my project, I will start describing my real problem. All I write above could be changed and discussed with us, but for now is working perfectly and for me is urgent resolve my current problem… but I accept suggestions for it!

In the project I have to group folders in groups and to stores the historic as I did before for Entidade, Carteira, Mesa and Folder. I remember you that each historic depends on each dimension, and I need to group 3 or 4 folders into a group and this group has a specific RacioCooke as Entidade, Carteira, Mesa and Folder. And the problem is that a folder in fact Dados could be in more than one group.
While in the SCD described before there is a relation OneToMany, and you could store your surrogateKey (Foreign Key) in the Fact Dados, in this case you couldn’t because there is a relation ManyToMany. I tried to use the structure below, but when I tested, didn’t work because it would create duplicate records in my fact Dados.

The Big Question
What is the hGRP_RacioCooke for the row 2131 in Fact DADOS for GRP01 (Investment) and for GRP02 (Negotiation)?

The Solution
I already found the solution and I will explain that later.
Kind Regards

Sunday, October 7, 2007

BI Tools - First look at Microsoft BI Tools

Dear Friends,
Following a suggestion of Rui Santos (master colleague), I'll try to write a draft about Microsoft BI Tools using my current BI project.
As you probably know, the current version of SQL Server 2005 has two separate environments, one for management and one for development.
The development environment is called Business Intelligence Development Studio (BIDS) and is focused mainly in business intelligence area. Includes a module for Data Integration (SSIS), another for Data Analysis (SSAS) and another for Report (SSRS). The management environment is called SQL Server Management Studio (SSMS) and it’s here that you do all the work managing your databases.

I don’t know yet the other BI tools, but what I heard from community is that Microsoft tools are more “user-friendly” than others. But in my master I will try SAS tools and I will know if it’s true or not.
I’m very satisfied with Microsoft, and If today BI is more popular is because Microsoft is investing a lot in BI technologies. Why I am say this? Well… is my opinion, but there was big improvements particularly in SQL 2005, SharePoint 2007 (usually used to file share in 2003 version), the acquisition of ProClarity (tools to analyze BI data), the acquisition of Dundas software (Report tools), Office 2007… and others…


For these reasons, I think BI is the right path to our careers, particularly Microsoft! But I think if we know the BI concepts, with some extra work we can use other tools like SAS, WebFocus, SAP and others without problems.

My current BI project is very complex and the old system was too difficult to understand (http://pedrocgd.blogspot.com/2007/06/ssis-temporary-image-to-msdn-forum.html) because it seemed like a data warehouse inside excel and access files… could you imagine that?!
In overall, the big difficulties was understanding the old system and define the best architecture.

Below I will show you some screenshots of Microsoft BI tools in my project.

SSIS - SQL Integration Services
As I wrote in a previous post, the goal of BI is provide the business with high data quality using intelligence! This module provides the right tools to transform, clean and audit data from several data sources and unsure that this data will be inserted correctly and compatible with destination structure – Is my concept of ETL.

Control Flow

Control Flow (Sequence container expanded)


SSAS - SQL Analysis Services
This module consisted of two major, and complementary, pieces of functionality: OLAP and Data Mining.
In this module you can add KPI (corporate measures), perspectives, translations and you must know the language of querying multi dimensional databases, MDX.
MDX is similar to SQL but while in SQL we query data from OLTP databases, with MDX we query data from OLTP databases.


Data Source View

Cube Designer

Calculations Designer (MDX Sintax)

Cube Browser

Cube Browser with some data


SSRS - SQL Reporting Services
Using the MDX, it's possible to create queries to an OLAP database and display here inside a table, matrix or in a chart.

Data designer (wizard)

MDX Data Designer

Report Designer


Don’t forget, this is a draft about each SQL BI module. If you think a more specific description of this subject could be useful, I will describe it better. (In the right panel you could see links of my preferred books)
Regards!

Thursday, October 4, 2007

BI CaseStudy - SSIS Package v2

Dear Friends,
In a previous post I described the first version of my current project main SSIS packages.
http://pedrocgd.blogspot.com/2007/06/ssis-packages-structures-v1.html

Today, I will describe how the main package changed. I‘ll probably do some changes to this version, depending on your feedback.
The majority of this objects are sequence containers objects and each of them has several steps inside.


This package will be executed in 95% of the cases for each day and it will import data of several data sources like SQL Server and Sybase. Sometimes the package could be executed not only for one date but between two dates to correct an unexpected error or for other unexpected reason.

1. SEQ VALIDATE Surrogate Keys
Step to validate my surrogate keys. (This step will be explained in a future post)

2. SEQ GET Configuration
Get the start and end date from the database table Configuration. These dates could be manual (stored in DB) or automatic (getting last date from main fact table Dados)

3. SEQ VALIDATE LastRunDate DADOS
Step to avoid inserting duplicate rows from an existent day in FactTable Dados

4. SEQ VALIDATE LastRunDate CASHFLOWS
Step to avoid inserting duplicate rows from an existent day in FactTable CashFlows

5. SEQ IMPORT SpotRates
Step to import currency rates based on Euro.

6. SEQ TRUNCATE Tables (Temporary)
Step to truncate tables. I will improve this step soon.

7. SEQ IMPORT TO FactTable CASHFLOWS
Step to Import data into FactTable CashFlows, FactTable BondsCouponLiq e BondsAmortLiq

8. SEQ GET IDENTITY Initial Values
Step to GET initial dimension identity values.
http://pedrocgd.blogspot.com/2007/05/ssis-populating-dimension_28.html

9. SEQ IMPORT TO FactTable DADOS
Step to import data into FactTable Dados and populate dimensions CounterParty and Instruments. Inside the sequence container there is several dataflows to import data into FactDados for each instrument like Equities, Bonds, Swaps, CapsFloor, Credit Swaps…

10. SEQ UPDATE FactTable DADOS
Step to update several fields like basel weight and risk into the rows inserted in the previous sequence container

11. SHRINK Database dbRentabilidade
Step to compact space in the database

12. SEND MAIL with SSIS Report
Step to send an e-mail with SSIS Report.


So, what improvements you think that could be done? Feel free to send feedback!!
Regards!

LinkWithin

Related Posts Plugin for WordPress, Blogger...