Tuesday, December 29, 2009

BI Dissertation – Master degree done!

Dissertation
Finally I got my master degree on Decision Support Systems/ Business Intelligence. It was almost 2 years and half and finally I defended my dissertation yesterday. I want to thank all those people who always encouraged me to “fight” for this and special thanks to my supervised Dr. Orlando Belo (Universidade do Minho – Portugal), Steve Vanstone (Bonds University – Australia) and Dr. Chong (Chinese University of Hong Kong – China). (Check out the previous post I wrote about the dissertation here)

Check below the abstract of my dissertation that I’m thinking to translate to English for sending to all those people around the world that gave me feedback about their works and some support to my dissertation.

Abstract
"In the current economic environment, the value of information is increasingly important in the habits and customs of each citizen. Prices per barrel of oil, Euribor rates, equity indexes, inflation rate, among others, arrive everyday at our homes through the media. Their study is increasingly important, especially by the need to identify their impact on our daily quotidian.

The application of Data Mining (DM) techniques, in an attempt to predict the movement of the stock market, has never been a very well accepted, mainly by economists and the academic world. It is an area of high complexity, and the fact that it involves money, mean that their research, especially successful, is not made public. However, these techniques exist, and are increasingly used not only in financial markets, but also in practically all other activity sectors.

This dissertation begins by making an approach to the complex world of the stock market, in an attempt to demystify it a little. Subsequently, based on investment rules normally applied by practitioners, it’s presented a model of an artificial neural network, which provides in a daily basis, the decision to buy, hold or sell a particular asset, supported by a decision support system to monitor and analyze the evolution of the made decisions."

Keywords: Decision Support Systems, Data Mining, Knowledge Discovery in Data, Business Intelligence, ETL, Data Warehousing

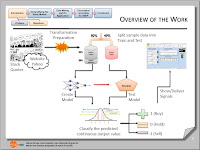
I also added some screenshots of dissertation presentation I made yesterday… if you’ll be curious about the data mining model results, just tell me and I will translate all slides.
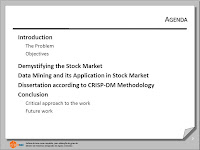
Dissertation AgendaDissertation problem
Dissertation Problem 2Dissertation ObjectivesDissertation OverviewDissertation Future Work
I hope you enjoy this. Regards,
Pedro.

Thursday, December 24, 2009

Merry Christmas

Merry Christmas
It is time to relax with the family and take care of those who truly love us and be forever on our side!
Merry christmas to you and to all your family.
Pedro

Saturday, December 19, 2009

BI Tools - First Look to Excel 2010

Create Dashboards never been so easy ... the new version of Excel 2010 (Beta) is really amazing. Exploration of a multidimensional cube has never been so intuitive and simple like it is now. The image below shows a simple dashboard that I made in this new version in 20 minutes for the Northwind database sample...

Excel Dashboard
There still are some features to improve in this version, anyway, the new features promise to make the life of the decision maker easier... and now, I sincerely believe that the democratization of business intelligence is beginning, and finally Business Intelligence will soon be available to all employees of an organization. And all because Excel is the best known tool in the world, where almost users who use a computer, know what Excel is and what Excel do. Many BI Vendors know it, and began to build few years ago, add-ins for Excel in order to take advantage of some previous limitations of Excel. And a question arises ... will these small businesses survive the constant improvement of Excel? Only time will tell whether they will be able to adapt or not with new solutions... I really hope so, becausee this small companies do a big important job… and Microsoft knows that!

Excel Slicer Excel Sparkline
As the most interesting features from Excel 2010, I highlight the slicers, the “sparklines”, and the possibility of creating Named Sets through Excel. The Slicers lets you visually filter the data in a PivotTable and quickly extract exactly the data you're looking for. Slicers can be moved and resized like charts and graphs. And each slicer could be connected to several pivot tables… for me it’s really amazing this feature. The “sparklines” is a copy of some products made before by XLCubed (check the SQL Bits session where XLCubed presented “Microcharts”) and it’s in a very early stage. And the last feature that I highlight today, is the possibility to create named sets from Excel, grouping a set of items and several other features like customize MDX statements of a pivot table.

I hope this post was helpfull to you.
regards, Pedro

Saturday, December 12, 2009

BI Guest Corner - Prospecting Like a Prostitute

I like too much learning through analogies, and for that reason today I come with a very interesting and comic analogy, created by Erik Luhrs who deserves a reference in this corner. In business Intelligence, (the main subject of this blog), sometimes we forget that all the work that is done in a business intelligence system has a main purpose… get more money (value) through good decisions that came’s in actions focused in the customers. And in this video, you get a fundamental lesson that you should always follow, target your audiences!!! And target your audiences with analytics…a sub-system of Business Intelligence System.
Prospecting Like a Prostitute
“Sometimes the greatest lessons are in the places you’d never think to look. In this video Erik Luhrs will show how workers in “the world’s oldest profession” still have some sales lessons to teach even the most professional and polished salespeople of today”

LinkWithin

Related Posts Plugin for WordPress, Blogger...